

You bought a token because the price looked cheap. Maybe it was trading at $0.05 while a competitor sat at $50. You figured you had found an undervalued gem. Six months later, that same token is down 80%, and your "gem" feels more like a rock. What went wrong? It likely wasn't just market sentiment or bad code. The culprit was often hidden in plain sight: Token Supply and how those tokens were distributed among insiders, investors, and the public.
Most beginners look at price charts. Smart investors look at supply mechanics. Price means nothing if there are millions of locked tokens waiting to hit the market next month. This guide breaks down exactly how supply works, why distribution matters more than hype, and how to spot a project that might dump on you before you even wake up.
The Three Types of Supply You Must Know
When you check a data aggregator like CoinMarketCap or CoinGecko, you see three different numbers for every asset. Confusing them is the fastest way to lose money. Let's clear this up with concrete examples.
Circulating Supply is what actually exists in the wild right now. These are the coins people can trade, hold, or spend today. They exclude tokens locked in smart contracts, held by the foundation for future grants, or reserved for the team but not yet unlocked. For example, as of late 2023, Bitcoin had roughly 19.5 million BTC in circulation out of its 21 million cap. That’s about 93% of its total potential supply already active. This high ratio means new buyers aren't facing massive dilution from newly minted coins flooding the market daily.
Total Supply includes everything currently created, including tokens that are locked or burned but still technically part of the protocol's accounting until fully removed. In some cases, Total Supply equals Circulating Supply plus Locked Tokens. If a project has 1 billion Total Supply but only 100 million Circulating, you’re looking at a 90% potential increase in available tokens. That’s a red flag if those locked tokens unlock soon.
Maximum Supply is the hard ceiling. It’s the absolute limit of tokens that will ever exist. Bitcoin has a fixed max supply of 21 million. Ethereum, however, doesn’t have a maximum supply cap; it relies on issuance rates and burning mechanisms to manage scarcity. Understanding whether a coin has a hard cap (like Bitcoin) or an elastic supply (like Ethereum) changes how you predict long-term value.
| Attribute | Bitcoin (BTC) | Ethereum (ETH) | Avalanche (AVAX) |
|---|---|---|---|
| Max Supply | 21 Million (Fixed) | No Cap (Dynamic) | 720 Million (Fixed) |
| Issuance Mechanism | Block Rewards (Halving) | Validator Rewards + Burn | Staking Rewards + Fee Burn |
| Inflation Trend | Deflationary over time | Variable (Net deflation possible) | Deflationary via burns |
| Circulating % (Approx) | >90% | ~100% (of created) | Varies by vesting |
Why Market Cap Lies Without Context
Here is a trap many newcomers fall into: they calculate market cap using the wrong supply number. Market Capitalization is calculated as Current Price × Circulating Supply. But savvy traders also watch Fully Diluted Valuation (FDV), which uses Current Price × Maximum Supply.
Imagine Token X trades at $1. Its circulating supply is 10 million. Its FDV is $10 million. Looks fine, right? But wait-its Max Supply is 100 million. The FDV is actually $100 million. If all those locked tokens enter circulation tomorrow, the price would need to drop significantly to maintain the same valuation, assuming demand stays flat. This is called dilution risk.
Research suggests that projects with less than 50% of their total supply in circulation face significant valuation challenges. Why? Because the market knows a flood is coming. When 60% of a token's supply is still locked, early buyers are essentially betting against future unlocks. According to industry analysis, assets with high FDV-to-Market-Cap ratios often underperform during bear markets because selling pressure outweighs buying interest.
The Danger Zone: Insider Allocations and Vesting
Distribution isn't just about how many tokens exist; it's about who holds them. If the founders and early venture capitalists hold 40% of the supply, you are the exit liquidity. They bought in at fractions of a cent. You bought in after the launch. When their lockup period ends, they sell to take profits, crashing the price.
Vesting schedules are designed to prevent this. A good vesting schedule releases tokens slowly over time. Typically, you want to see:
- Cliff Period: A period (often 6-12 months) where no tokens are released. This ensures the team is committed before cashing out.
- Linear Vesting: After the cliff, tokens release monthly or quarterly over 2-4 years. This aligns incentives. If the team dumps all at once, the project dies. If they stay, the project grows.
Data from Messari indicates that projects with graded vesting schedules (12-24 month lockups) experience 43% lower price volatility in their first year compared to those with immediate full unlocks. Conversely, Dr. Neha Narula from MIT warns that excessive insider allocations (over 30%) create immediate sell pressure. If you see a whitepaper stating "Team Allocation: 25%" with a "1-year lockup," be cautious. One year goes by fast. By then, the initial hype may have faded, leaving retail investors holding the bag.

Issuance Models: Fixed vs. Dynamic
How are new tokens created? This affects inflation and scarcity.
Fixed Issuance (Bitcoin Model): New coins are created at a predictable rate. Bitcoin halves its block reward every four years. This creates programmed scarcity. Investors love this because it removes human discretion. No CEO can decide to print more Bitcoin. However, critics argue this can lead to hoarding and reduced utility as a currency, since people expect prices to rise due to scarcity.
Dynamic Issuance (Ethereum Model): Ethereum adjusts issuance based on network participation. Since the Merge, ETH issuance dropped significantly, and the EIP-1559 burn mechanism destroys fees. During periods of high network activity, more ETH is burned than created, leading to net deflation. This model is flexible but complex. It requires users to monitor network usage to understand true supply dynamics.
Rebase Models (Ampleforth): Some experimental projects use algorithmic rebasing, where wallet balances change automatically to maintain a pegged price. While innovative, these models are risky and poorly understood by the average investor. Most experts recommend sticking to transparent, rule-based issuance models unless you deeply understand the underlying math.
How to Audit a Token’s Distribution
Before you invest, do your homework. Don't just trust the website. Use blockchain explorers and tokenomics platforms. Here is a checklist:
- Check the Unlock Schedule: Look for upcoming large unlocks. Sites like TokenUnlocks.io track these events. If a major unlock is scheduled for next week, expect volatility.
- Analyze Holder Concentration: Use a block explorer to see the top 10 holders. If the top 10 wallets hold 80% of the supply, the project is centralized and vulnerable to manipulation. Ideally, no single entity should control more than 5-10%.
- Verify Treasury Holdings: Many projects keep a treasury for development and marketing. Ensure these funds are managed transparently. Are they multisig wallets? Who controls them?
- Read the Whitepaper Critically: Look for vague terms like "community rewards." How much is allocated? To whom? Vague distributions usually mean insiders get more than they admit.
For instance, Polkadot allocated 58.4% to public investors and 30% to insiders. While the insider portion is high, the public allocation helped decentralize ownership. Compare this to newer memecoins where 90% might go to the founder's wallet. The latter is far riskier.
Real-World Impact: Burns and Buybacks
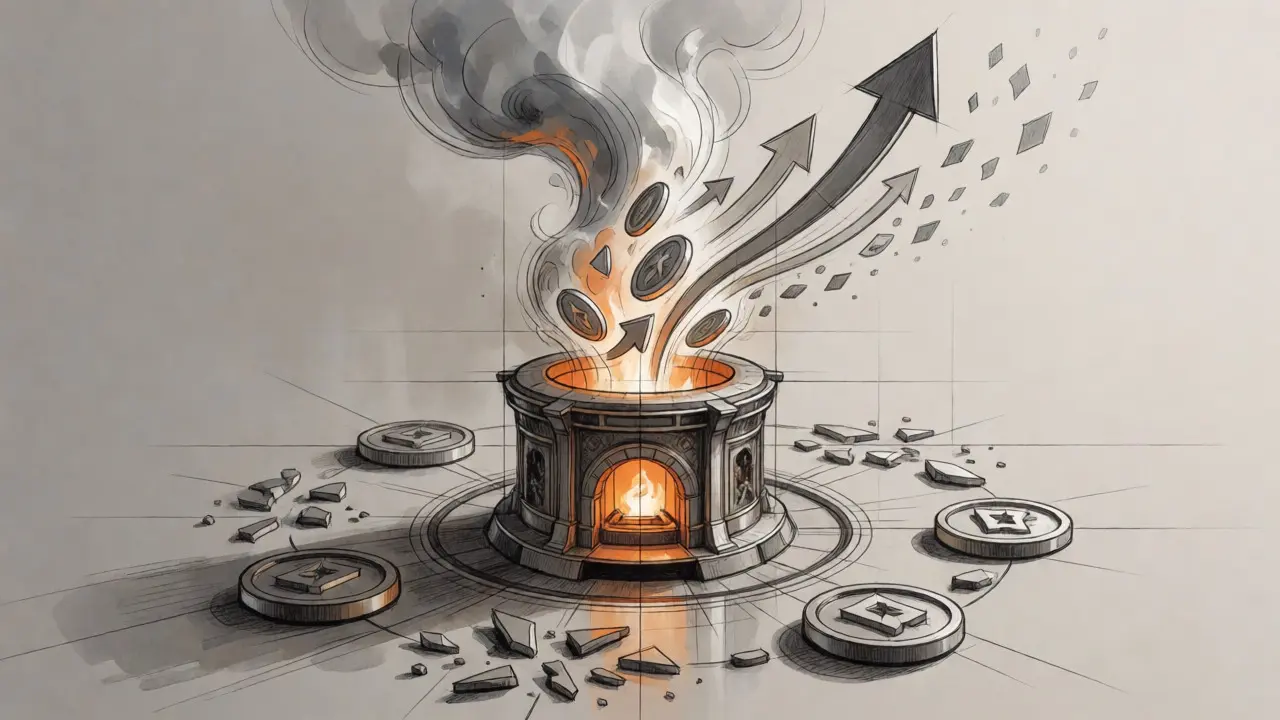
Some projects actively reduce supply to support price. This is done through token burns. When Crypto.com burned 260.2 million CRO tokens in June 2022, the circulating supply dropped, contributing to a 12.7% price increase within 72 hours. This demonstrates that supply shocks matter.
However, burns are only effective if they are sustainable. A one-time burn is a marketing stunt. A continuous burn tied to transaction volume (like Binance's BNB quarterly burns) creates a structural deflationary pressure. Always ask: Is the burn funded by revenue, or did they just destroy tokens they printed earlier? If they printed 1 billion and burned 100 million, they still issued 900 million net new tokens. Net issuance is the key metric, not gross burns.
Final Thoughts on Sustainability
Tokenomics isn't static. It evolves with the project. Early-stage projects often prioritize raising capital, leading to heavy insider allocations. Mature projects focus on sustainability, shifting toward community-driven distributions and staking rewards.
Remember, a low price per token doesn't mean it's cheap. A high price doesn't mean it's expensive. It’s all about supply relative to demand. Projects with clear issuance schedules, transparent vesting, and balanced distribution tend to survive multiple market cycles. Those with opaque models and heavy insider holdings often fail when the hype fades.
Next time you evaluate a crypto asset, ignore the price chart for five minutes. Open the tokenomics section. Ask yourself: Who owns the supply? When do they get paid? And what happens when they do? Your answers will protect your portfolio better than any technical indicator.
What is the difference between circulating supply and total supply?
Circulating supply refers to the number of tokens currently available for trading and held by the public. Total supply includes all tokens that have been created, including those that are locked, reserved for the team, or held in treasuries but not yet released to the market. Circulating supply is used to calculate standard market cap, while total supply helps assess potential future dilution.
Why does Fully Diluted Valuation (FDV) matter?
FDV assumes all tokens are in circulation. It provides a worst-case scenario valuation. If a project has a high FDV compared to its current market cap, it signals that a large amount of supply is still locked. When these tokens unlock, increased supply can put downward pressure on the price if demand doesn't grow proportionally.
Is a fixed max supply always better than uncapped supply?
Not necessarily. Bitcoin's fixed supply creates scarcity, which supports price appreciation. However, Ethereum's uncapped supply allows for flexible monetary policy. Through mechanisms like EIP-1559, Ethereum can become deflationary during high usage. The best model depends on the network's utility and how effectively it manages issuance versus burn rates.
What is a vesting cliff?
A vesting cliff is a period at the beginning of a token distribution schedule during which no tokens are released. For example, a 12-month cliff means team members receive zero tokens for the first year. This prevents immediate dumping and ensures contributors remain engaged with the project before earning their rewards.
How do token burns affect price?
Token burns permanently remove tokens from circulation, reducing supply. If demand remains constant or increases, a reduction in supply typically leads to higher prices. However, burns must be sustained and funded by actual revenue to be effective; one-off burns are often short-lived marketing tactics.